
A rate adjusts for time, not for everything else
Per-minute statistics answer a narrow question: how frequently was an event recorded during a player's active time? They help distinguish a large total accumulated over many minutes from a smaller total accumulated quickly. They do not, on their own, identify the better player.
BenchClock reports events or attributed points per ten field minutes. The calculation uses recorded active time, not time since the team arrived, bench time, or an assumed regulation match duration. Both the numerator and denominator depend on accurate manual recording.
This guide uses fictional arithmetic examples, not team results or recommended selection rankings. The useful habit is to read the count, minutes, and rate together. A rate without its sample size invites a stronger conclusion than the record supports.
Calculate the rate from totals
The formula is summed events divided by summed field minutes, multiplied by ten. Suppose Alex records six selected events over thirty field minutes. Six divided by thirty, multiplied by ten, equals two events per ten minutes.
Now suppose those events came from two matches: four events in ten minutes and two events in twenty minutes. The separate match rates are four and one per ten minutes. Simply averaging those rates gives 2.5, which is wrong for the combined record because the matches contributed different amounts of playing time.
Instead add the events, add the minutes, then divide: six events over thirty minutes gives two per ten. BenchClock uses this ratio-of-sums approach. The longer appearance correctly contributes more exposure to the combined denominator.
This also explains why a season rate may not equal the average of the rounded rates shown in individual match notes. Rounding and unequal playing time both matter. Recalculate from the underlying totals when you want to audit a result.
Keep events, points, and scoreboard totals distinct
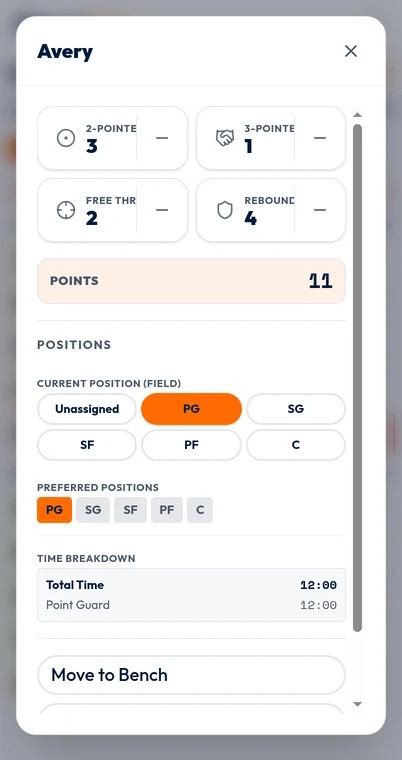
A selected-stat event count is not necessarily a point total. In a basketball configuration, a Made 3 event can have a point value of three. Two such events are two events and six attributed points. A non-scoring stat with a zero point value can still have a meaningful event rate.
Attributed points sum each recorded quick-stat count multiplied by its saved point value. Points per ten minutes uses that attributed total; events per ten minutes uses the selected stat's event count. If you change the selected Stat filter, you are changing which event count the report describes, not redefining the game scoreboard.
The scoreboard is recorded separately. Missing player attribution can leave the team score higher than the sum of player points. Do not use a clean-looking points-per-minute number as proof that all scoring events were captured.
Before comparing records, check their saved configuration. The same slot number must not stand for rebounds in one match and assists in another. BenchClock's compatibility groups keep different complete definitions separate instead of silently combining unlike counts.
See why a short appearance can dominate a ranking
Imagine Morgan records one event in two field minutes. The rate is five events per ten minutes, higher than Alex's two. That does not mean Morgan would record five events in a ten-minute appearance. It describes one observed event scaled to a common time unit.
If Morgan then plays eight more minutes without another event, the combined rate becomes one event per ten minutes. Nothing about the original arithmetic was false; the sample was simply very sensitive to the next few minutes. This is why a tiny sample should be a visible warning, not a hidden footnote.
Use the Min Mins control in reports to define a minimum exposure for rate comparisons. For a hypothetical review, you might choose twenty field minutes so that two-minute appearances are flagged as low sample. Twenty is an illustrative workflow choice, not a scientifically validated threshold or a youth-sport standard.
The threshold marks eligibility for rate comparison; it does not make the underlying minutes disappear or convert an uncertain rate into a reliable talent estimate. Select the threshold before looking for a preferred result, then keep it consistent while answering that question.
Read zeroes and missing rates correctly
Zero events over positive field minutes produces an event rate of zero. It means no selected event was recorded during those minutes. It does not prove the player had no opportunities, made no useful contributions, or was fully observed.
Zero field minutes leaves a per-minute rate without a valid denominator. Treat an unavailable value as unavailable, not as a zero rate. Similarly, minutes per event cannot produce a meaningful finite value when the event count is zero.
BenchClock also describes scoring share relative to time share. A value of 1.0 means the player's share of recorded attributed points is proportional to their share of all-player field minutes in the selected cohort. It is not an overall player-value rating and should not be read as one. Defensive work and untracked actions may be absent entirely.
Add the context a time denominator cannot supply
Minutes do not adjust for possession, opposition strength, game state, position, teammates, or the task the coach assigned. A goalkeeper and a forward can have equal active time but radically different chances to record a scoring event. Two basketball players can have equal minutes and different numbers of possessions.
Manual recording adds another limitation. If one match had an attentive stat recorder and another had an adult also handling substitutions and injuries, apparent changes in rate may partly reflect observation quality. Check whether the recording routine stayed consistent before interpreting a trend.
Use a surprising rate to ask a better question: Did the player receive different opportunities? Was the event definition clear? Was the active time correct? Plan an observation that can answer the question rather than using the number alone to change a child's role.
- Read the raw event count and field minutes beside the rate.
- Combine records using summed counts and summed minutes.
- Check compatibility and minimum-minute eligibility.
- Compare similar roles and explain obvious contextual differences.
- Treat unavailable denominators and missing observations honestly.
Use the report as evidence, not a verdict
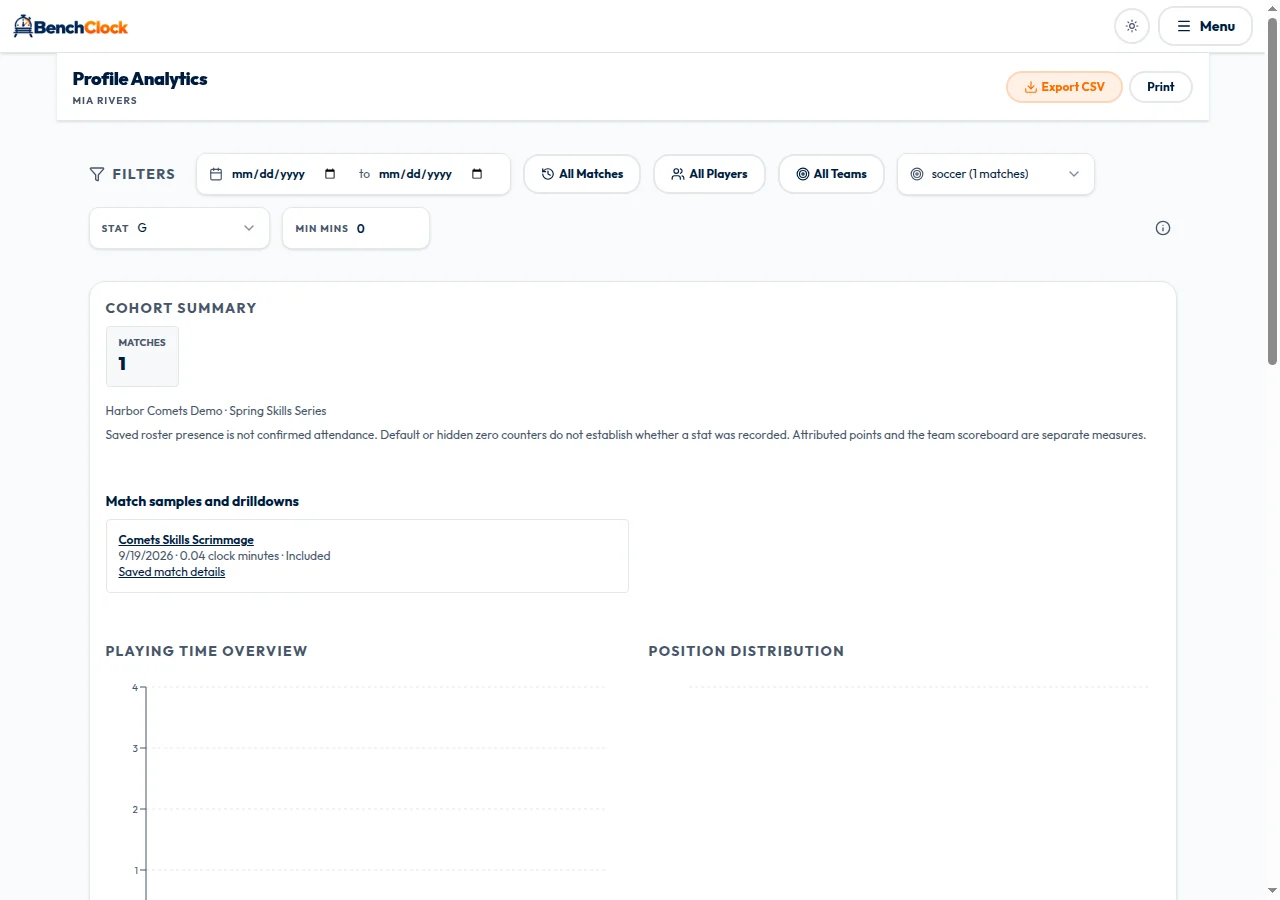
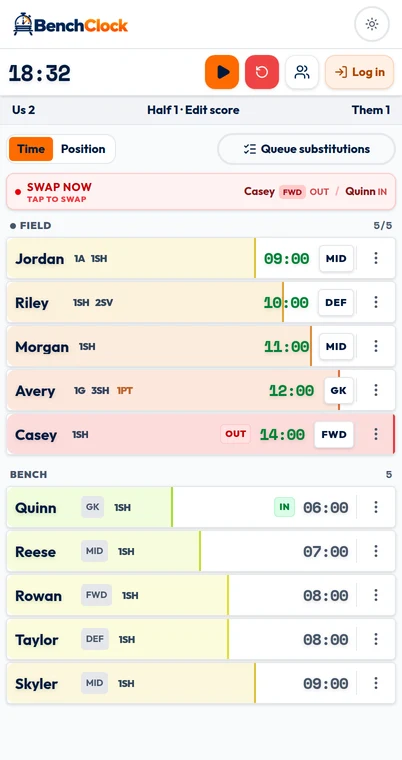
Connected reports require the appropriate account and team permissions and use qualifying finished, started matches. The connected screenshot is a real filtered report, but its single synthetic soccer match lasted only a few seconds and recorded no events, so it is not evidence for the fictional rate comparisons in this guide. The local screenshots separately show how event and minute inputs are recorded.
When you next open a report, choose one stat and calculate one player's rate by hand. If the meaning is clear, use it to support a coaching question. If the meaning is unclear, simplify the definitions or improve the record before creating comparisons.